Boyle's Law
- Below is a typical data table comparing measurements taken of the
pressure and volume:
|
Trial
|
P (cm3)
|
V (cm3)
|
PV (atm*cm3)
|
|
1
|
4.0
|
2.5
|
10
|
|
2
|
2.0
|
5.0
|
10
|
|
3
|
1.0
|
10
|
10
|
|
4
|
0.5
|
20
|
10
|
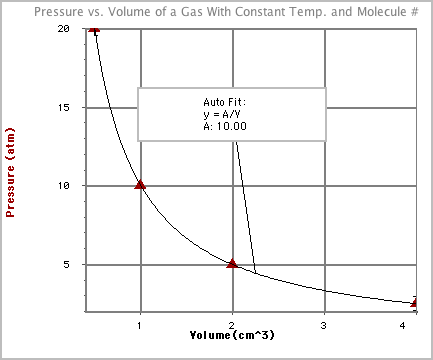
- A graph of this data looks like this:

- Notice that we can compare P*V for any two trials and that they are equal.
For example, if we compare trial 2 and 3 we get 2.0 atm*5.0 cm3
= 1.0 atm*10 cm3 = 10 atm*cm3.
- Boyle demonstrated that the relationship of pressure to volume of a gas
can be described mathematically by the following relationship: PV = constant.
If this is true then we can set up the equality between PV from one trial
to PV of a second trial. Mathematically expressed as P1V1=P2V2
or Boyle's Law.
- Two assumptions about the experimental conditions must be made for this
relationship to be true. What are they? (What other factors can affect pressure
or volume?)
- Look back at the data table. Notice that as the pressure doubles, the volume
is cut in half or as the volume doubles, the pressure is cut in half. This
kind of relationship is known as inversely proportional and will give
you a graph shaped like the one above.
- Boyle's Law can be derived from the function used to best fit the curve
to the data:
y = A/x or
y=constant/x or
P=constant/V or
PV = constant so
P1V1=P2V2
- The constant for each experiment can be different depending on how the experiment
is set up. However, within a single experiment where the temperature and moles
of gas remain constant the constant relationship of P*V should be true.
- Let's do an example problem: If you started out here where the pressure
is a standard 760.0mmHg and blow a balloon up to a volume of 500.0 ml, and
then go to Breckenridge, CO (elevation 9600 ft.) where the pressure is 540.0
mmHg. Assuming the temperature is the same and that the balloon doesn't have
a leak, what would be the size of the balloon when you get to Colorado? Click
here to see the answer.
